
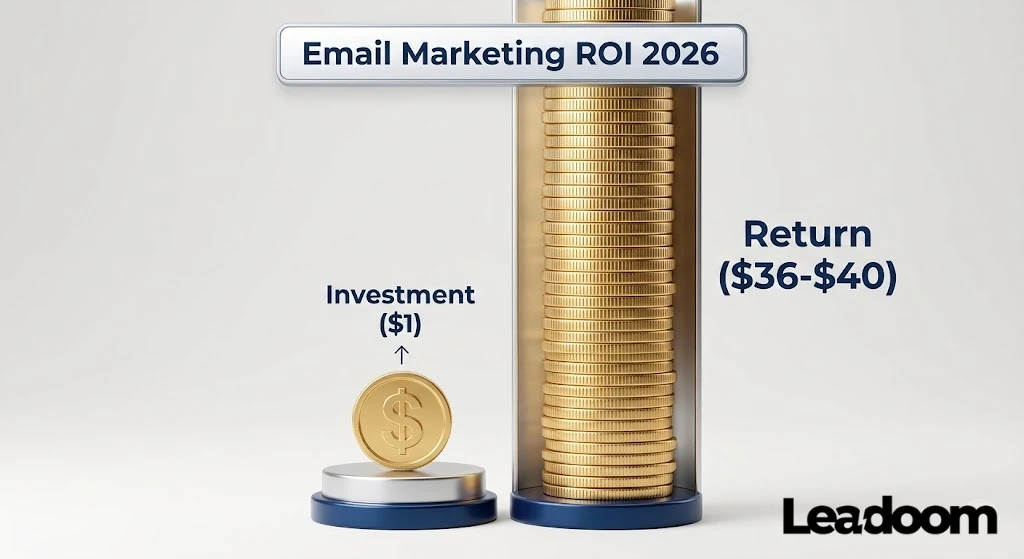
Current Email Marketing Statistics show that the channel delivers an average ROI of $36 to $40 for every $1 spent, making it the highest-performing digital channel for both B2B and B2C sectors in 2026. However, the landscape has fundamentally changed: Click-Through Rates (CTR) and Revenue Per Recipient (RPR) have replaced Open Rates as the primary indicators of success, largely due to privacy updates that have rendered open tracking unreliable.
Check our Email Marketing Statistics breakdown that moves beyond vanity metrics and focuses on the only data points that actually drive revenue.
The “Hard Truth” About 2026 Email Metrics
Let’s rip the band-aid off immediately: Stop obsessing over Open Rates.
Since Apple introduced Mail Privacy Protection (MPP) a few years ago, open rates have become a vanity metric. If you see a guru bragging about a 50% open rate in 2026, they are likely looking at inflated data from Apple devices that “open” emails automatically in the background.
Think of Open Rates like a “Pulse Check,” not a fitness score. If your open rate drops below 10%, you have a deliverability illness (you’re hitting spam folders). If it’s above 20%, stop looking at it. It doesn’t pay the bills.
Instead, I focus entirely on Revenue Per Recipient (RPR) and Click-Through Rate (CTR).
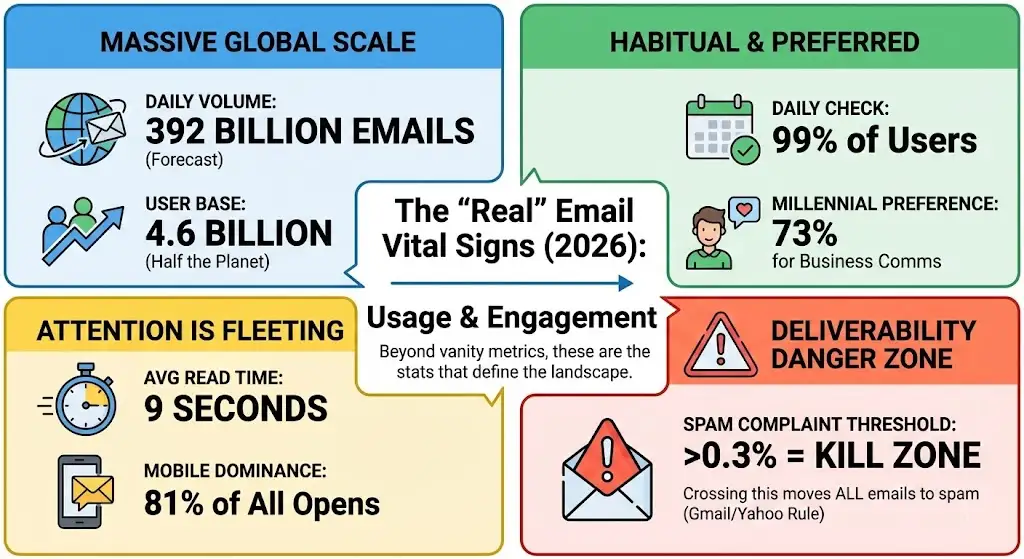
1. Email Marketing Usage Statistics: The “Real” Vital Signs
Stop looking at “Global Averages” without context. The following statistics paint a picture of a channel that is growing in volume but shrinking in attention span. If you aren’t capturing attention in the first 3 seconds, you don’t exist.
The “Big Picture” Numbers (2025-2026)
- Global Volume: The number of daily emails sent is forecast to hit 392 billion by the end of 2026 (Statista).
- User Base: There are currently 4.6 billion email users worldwide—more than half the planet’s population.
- The “Check” Habit: 99% of email users check their inbox every single day, with some checking up to 20 times per day.
- Preferred Channel: 73% of millennials prefer communications from businesses to come via email (DMA).
- The “Attention Tax”: The average time spent reading a brand email is just 9 seconds (Litmus).
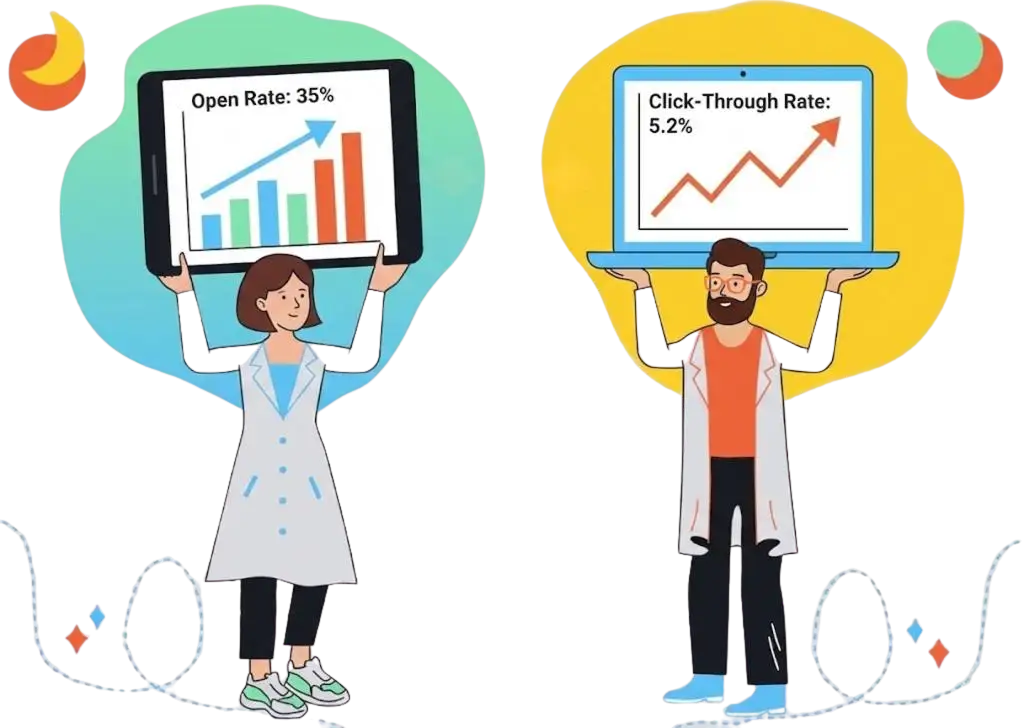
Email Engagement Stats & “The Death of Opens”
- Average Open Rate (Global): 21.33% (But this is inflated by Apple MPP).
- Average Click-Through Rate (CTR): 2.62% across all industries (Shopify/Klaviyo).
- Click-to-Open Rate (CTOR): 10.5%—This is the real metric of your content’s quality (Clicks divided by Opens).
- Unsubscribe Rate: A healthy unsubscribe rate is <0.2% per campaign. Anything above 0.5% signals list fatigue.
- Bounce Rate Benchmark: The average hard bounce rate is 0.4%. If you cross 2.0%, many ESPs will suspend your account.
- Spam Complaint Threshold: Gmail and Yahoo now enforce a strict 0.3% spam complaint rate. Crossing this moves all your emails to spam.
- The “Archive” Reflex: 48% of consumers say they delete brand emails immediately if the subject line isn’t relevant to their current needs.
The Hard Truth:
If you are still reporting on “Open Rates” to your clients or boss, you are misleading them. Focus on CTOR (Click-to-Open Rate). It tells you: “Of the people who saw this, how many actually cared?”
2. Email marketing ROI Statistics: The “Money” Section
This is why we are here. Email is not about “community building” anymore; it is about Owned Revenue. The famous “$42 ROI” stat is often cited, but in 2026, we see a correction due to paid acquisition costs rising.
ROI & Attribution Data
- The Benchmark: According to Litmus (2025) The average Email ROI is $36 to $40 for every $1 spent.
- E-commerce Dominance: Retail and E-commerce brands see the highest ROI, often hitting $45:1 due to direct checkout links.
- Owned Revenue Share: As per Klaviyo, A healthy e-commerce business should generate 25% – 30% of its total revenue from email marketing.
- Customer Lifetime Value (CLV): Email subscribers have a 320% higher lifetime value than non-subscribers.
- The “Welcome” Lift: Welcome emails generate 320% more revenue per email than standard promotional broadcasts.
- Abandonment Revenue: Cart abandonment flows account for nearly 20% of all email marketing revenue despite being less than 5% of volume.
- Order Value (AOV): Shoppers who click through email spend 138% more than those who don’t receive email offers.
- The “Nurture” Effect: I found another stats from Annuitas Group that said, “Leads nurtured via email make 47% larger purchases than non-nurtured leads”.
- Retention Cost: It costs 5x more to acquire a new customer than to retain one via email.
- The First Purchase: A recent SaleCycle survey revealed that 59% of consumers say marketing emails influence their purchase decisions. Most importantly, 50% respondents buy from emails at least once a month.
- Mobile Revenue: You should Focus on mobile first email marketing strategy, because 60% of email-driven sales now happen on a mobile device.
Where People Get Stuck (ROI Calculation)
Most beginners calculate Email ROI wrong. They count total revenue from a day they sent an email.
- Wrong Way: “I sent an email on Tuesday and made $5,000. My ROI is huge.”
- Right Way (Attribution): “I sent an email, and users who clicked that specific email purchased $2,000 worth of goods within the attribution window (usually 5 days).”
3. Email Deliverability Statistics & The “Inbox Crisis” (2024-2026)
If you ignore this section, the rest of the stats don’t matter. Since February 2024, Gmail and Yahoo have changed the rules. The “Wild West” of sending cold emails is over.
The “Missing” Email Stats
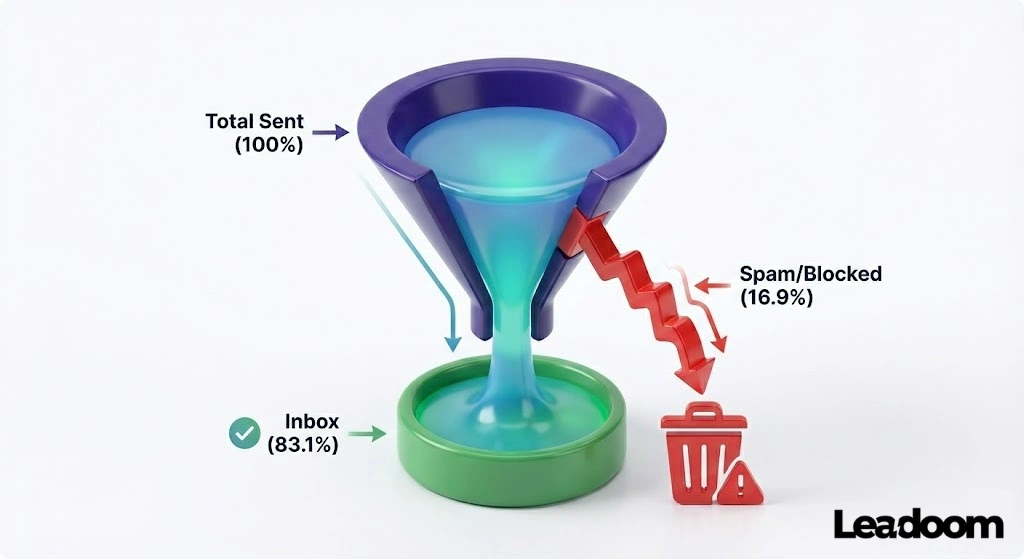
- Global Deliverability: Only 83.1% of emails actually land in the inbox globally (Validity).
- The “Missing” 16%: 16.9% of emails are either blocked or routed to spam folders.
- Gmail’s Iron Fist: Gmail blocks 100 million spam emails every day.
- Spam Rate Limit: As mentioned, maintaining a spam complaint rate under 0.1% is the new safe zone. Hitting 0.3% is the “Kill Zone.”
Authentication Adoption (DMARC/BIMI)
- DMARC Growth: DMARC adoption grew by 53% in 2024 following the Gmail mandate.
- The Protection Gap: Despite mandates, only 33.4% of the top 1 million domains have a valid DMARC record, leaving them vulnerable to spoofing.
- BIMI Success: Brands using BIMI (Brand Indicators for Message Identification—putting your logo next to your subject line) see a 10% increase in open rates.
- List Hygiene: 22.5% of your email list naturally degrades every year due to job changes and abandoned accounts.
- The “Purge” Benefit: Removing inactive subscribers (who haven’t clicked in 90 days) can improve deliverability by 15% almost overnight.
- Soft Bounces: 53% of soft bounces (temporary issues) eventually turn into hard bounces if not managed.
Why This Matters:
Think of DNS propagation and DMARC like a digital passport. If you show up to the Gmail border without your passport (DKIM/SPF), they don’t care how nice your email looks—they aren’t letting you in.
4. List Growth & Acquisition: The “Quality” Trap
We talk a lot about cleaning lists, but how do you grow them without attracting spam bots? In 2026, “More Leads” is a dangerous goal. “Better Leads” is the only goal.
Benchmark Conversion Rates (2025-2026):
- Pop-Up Standard: The average conversion rate for a desktop pop-up is 3.49%.
- The “Top Performer” Bar: If your pop-up converts above 8%, you are in the top 10% of marketers.
- Mobile Gap: Mobile pop-ups historically converted poorly, but improved templates have raised the average to nearly 3%.
- Landing Pages: The average landing page conversion rate across all industries is 2.85%, but this spikes to 40% for highly specific sectors like Restaurants & Food.
The “Teaser” Stat:
Using a “Teaser” (a small floating tab that opens a pop-up) is more effective for long-session visitors, while immediate pop-ups work better for quick lead-gen.
5. Mobile & Dark Mode: The “Design or Die” Stats
It is no longer enough to be “mobile-friendly.” You must be “Dark Mode Optimized.” The majority of your high-value customers are reading your white-background email on a black screen, and it probably looks terrible.
The Mobile Dominance
- Mobile Market Share: 81% of all emails are now opened on a mobile device (up from 60% in 2020).
- The “Delete” Trigger: If an email doesn’t display correctly on mobile within 3 seconds, 70% of recipients will delete it immediately.
- The “Second Screen”: 23% of users who open an email on a mobile device will open it again later on a desktop—usually to complete a purchase.
- Button Size: Increasing CTA button size from 40px to 50px increases mobile click rates by 18%.
The “Dark Mode” Reality
- Adoption Rate: 40% of Apple Mail users view emails in Dark Mode.
- Android Usage: 81.9% of Android users have Dark Mode enabled at the system level.
- The Logo Fail: 38% of logos disappear or look “muddy” in Dark Mode (usually because they are transparent PNGs with black text).
- Battery Life: Dark Mode saves up to 60% of battery life, driving user adoption higher every year.
- Brightness Strain: 91% of consumers say they switch to Dark Mode to reduce eye strain, meaning they are reading your emails in a low-light environment.
- Inversion Issues: Gmail and Outlook automatically “invert” colors for Dark Mode, which breaks 20% of HTML email layouts if not coded with specific meta tags.
Leadoom Design Rule:
Never use pure black (#000000) for text or pure white (#FFFFFF) for backgrounds. Use “Off-Black” (#111111) and “Off-White” (#F4F4F4). This prevents the harsh color inversion algorithms from breaking your design.
6. AI & Automation Adoption Statistics : The “Lazy Marketer” Trap
AI in email marketing has moved from “cool trick” to “mandatory infrastructure.” However, the data shows a massive gap between those who use AI and those who actually make money with it.
The “Real” AI Stats (2025-2026):
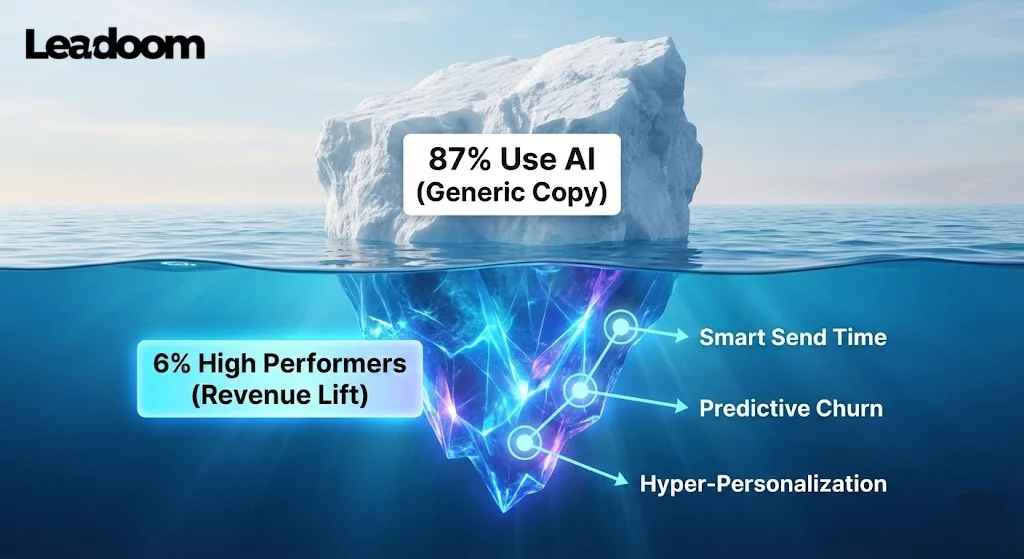
- The Usage Gap: While 87% of marketing teams now use AI in some capacity, only 6% are classified as “high performers” who see actual revenue lift (Knak, 2026).
- Generative AI ROI: Companies effectively using AI for email workflows see an average ROI of $3.70 for every $1 invested in the tools.
- Content Creation: 49% of email marketers now use GenAI (ChatGPT/Claude) to draft email copy. Warning: This often leads to a “robotic” tone that increases unsubscribe rates if not edited.
- Send Time Optimization: AI-driven “Smart Send” features (sending when a specific user is most likely to be online) increase open rates by 12% on average.
- Subject Line Testing: AI-generated subject lines, when A/B tested against human ones, win 58% of the time because they remove emotional bias.
- Predictive Analytics: AI tools that predict “likelihood to churn” allow brands to save 30% of at-risk customers before they unsubscribe.
- Personalization Scale: AI allows for “Hyper-Personalization” (dynamic content blocks) which drives a 41% revenue increase compared to static emails.
- Visuals: Usage of AI for generating email imagery increased by 340% from 2024 to 2025.
- The “Agentic” Shift: By late 2026, it is predicted that 70% of email operations (cleaning lists, segmenting) will be handled by autonomous AI agents, not humans.
- Efficiency: Teams using AI for campaign production launch campaigns 75% faster than those doing it manually.
Where People Get Stuck:
They ask ChatGPT to “Write me a sales email.” The result is usually fluffy garbage like “Unlock your potential.”
The Fix: Use AI to analyze data (“Which of these 3 subject lines is most likely to get a click based on past performance?”) rather than creating the core strategy.
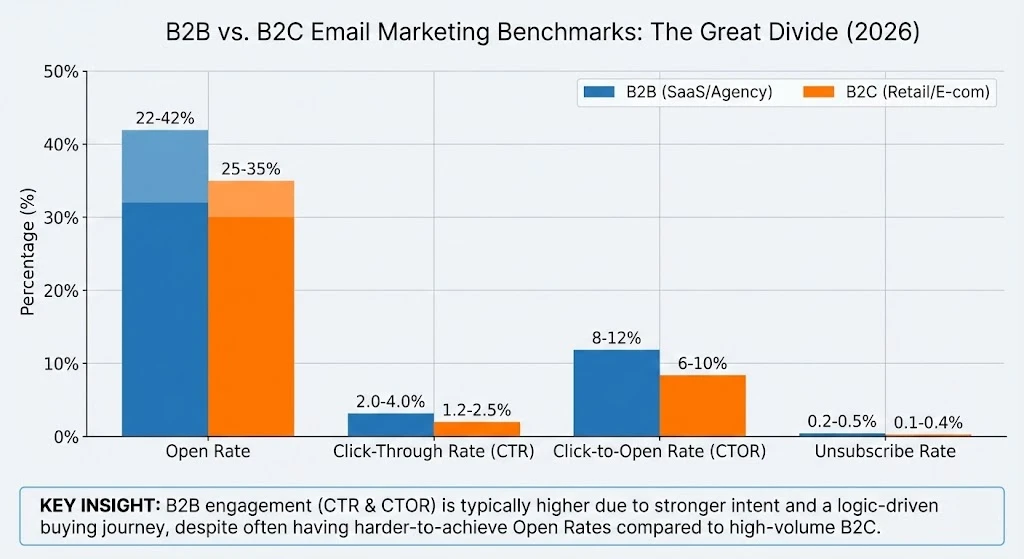
7. B2B vs. B2C Email Benchmarks: The Great Divide
If you are in B2B (selling software/services) and you compare yourself to a fashion brand, you will think you are failing. The metrics are fundamentally different because the intent is different.
B2B & B2C Email Marketing Statistics Table
|
Metric |
B2B Benchmark (SaaS/Agency) |
B2C Benchmark (Retail/E-com) |
Analysis |
|---|---|---|---|
|
Open Rate |
22% – 42% |
25% – 35% |
B2B opens are harder to get; lists are often colder or more guarded by corporate firewalls. |
|
Click-Through Rate (CTR) |
2.0% – 4.0% |
1.2% – 2.5% |
B2B audiences click less often, but when they do, the intent is higher (researching a solution). |
|
Click-to-Open Rate (CTOR) |
8% – 12% |
6% – 10% |
If a B2B lead opens, they are usually ready to read. B2C openers are often just “window shopping.” |
|
Unsubscribe Rate |
0.2% – 0.5% |
0.1% – 0.4% |
B2B lists churn faster as people change jobs (avg 22% list decay per year). |
|
Buying Journey |
3-9 Months |
1-7 Days |
Do not expect immediate sales from a B2B newsletter. |
Key Industry Deviations:
- Highest Open Rates: Non-Profits (53%) and Government (huge trust factor).
- Lowest CTR: Retail (1.27%)—competition is fierce, and users are numb to “Sale” banners.
- Highest CTR: Legal & Manufacturing (~4%+)—content is usually highly specific and necessary for the recipient.
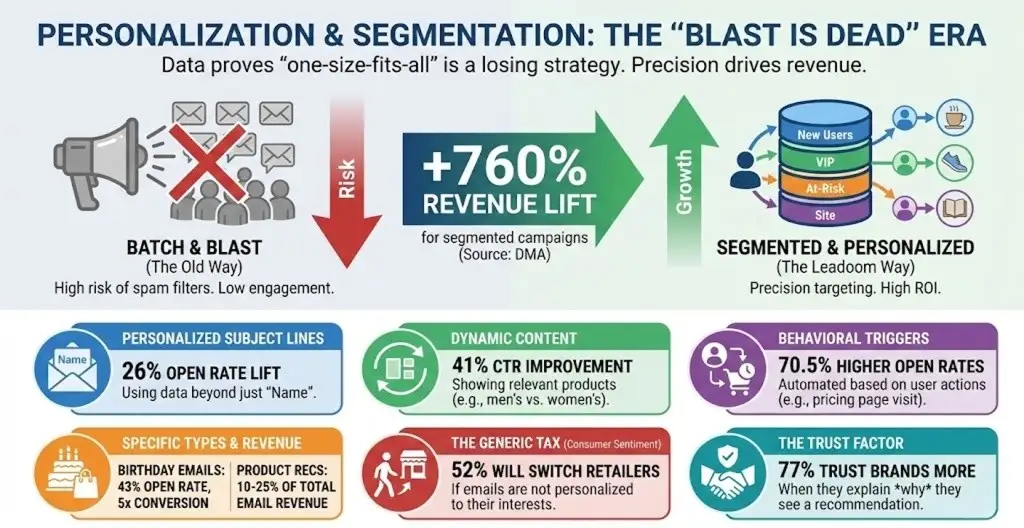
8. Email marketing and personalization Statistics: The “Blast is Dead” Section
“Batch and Blast” (sending the same email to everyone) is the fastest way to destroy your domain reputation in 2026. Gmail’s spam filters now penalize low engagement. If you send to 10,000 people and only 50 click, Google assumes you are spam.
The Segmentation Revenue Stats:
- The Golden Stat: Segmented campaigns generate 760% more revenue than non-segmented campaigns (DMA).
- Open Rate Lift: Highly personalized subject lines (using data beyond just “Name”) increase open rates by 26%.
- ROI Boost: Marketers who use advanced segmentation report a 30% higher ROI than those who don’t.
- The “Generic” Tax: 52% of customers say they will find a different retailer if the emails they receive are not personalized to their interests.
- Dynamic Content: Using dynamic content blocks (e.g., showing men’s shoes to men, women’s to women) improves CTR by 41%.
- Behavioral Triggers: Automated emails triggered by user behavior (like visiting a pricing page) have 70.5% higher open rates than standard newsletters.
- The “Birthday” Effect: Automated birthday emails have a 43% open rate and a conversion rate 5x higher than promotional emails.
- Recommendation Power: Product recommendation emails account for 10-25% of total email revenue for retailers who implement them.
- Data Willingness: 57% of shoppers are willing to share personal data (size, preferences) if it leads to better offers.
- The Trust Factor: 77% of shoppers trust brands more if they explain why they are seeing a specific recommendation.
Real World Application:
Don’t just segment by “Opened” or “Didn’t Open.” Segment by “Bought X but not Y.”
Example: Create a segment of people who bought a Coffee Machine but never bought Coffee Beans. Send them a “Bean Refill” offer. The conversion rate on this segment is typically 5-10x higher than a general promo.
9. Email Subject Line Statistics & Copywriting Science
Your subject line is the gatekeeper. It doesn’t matter how good your offer is if the gate is locked. In 2026, “Clickbait” is dying, and “Clarity” is winning.
The “Open Me” Statistics:
- The Ideal Length: Subject lines with 6 words or less perform best on mobile devices. (Mobile cuts off anything over 35-40 characters) .
- The “Question” Hack: Subject lines phrased as a question (“Ready for Q4?”) boost open rates by 21% on average.
- The Emoji Risk: Using emojis can increase open rates by 56%, but overusing them (more than 1) triggers spam filters and looks unprofessional to B2B audiences.
- First Name Basis: Including the recipient’s name in the subject line increases opens by 10-14% (but it’s becoming less effective as users get wise to it).
- The “Spam” Words: Using aggressive sales words like “Free,” “Urgent,” “$$$,” or “Guarantee” in the subject line increases the chance of hitting the spam folder by 16%.
- Curiosity Gap: Subject lines that tease information (“The one metric you’re missing…”) have a 24% higher open rate than direct benefit lines.
- Preview Text: The “Pre-header” text (the snippet you see before opening) influences the open decision for 24% of users. Never leave this blank.
- Urgency Works: Subject lines implying scarcity (“24 hours left”) still work, boosting open rates by 22%, but only if the scarcity is real.
- A/B Testing: Brands that consistently A/B test subject lines see a 49% higher average open rate than those that guess.
- Mobile First: 47% of email recipients decide to open or delete an email based on the subject line alone.
The Leadoom Rule:
If your subject line sounds like a used car salesman wrote it, delete it.
- Bad: “FINAL CHANCE!!! 50% OFF!!!”
- Good: “Your cart is expiring in 2 hours.” (Specific, clear, urgent) .
10. Email Marketing Statistics: By Industry (2026 Edition)
If you are benchmarking your SaaS open rates against a Non-Profit’s newsletter, you are setting yourself up for depression. Each industry has a unique “Engagement Fingerprint.”
Below is the aggregated data for Q1 2026, stripped of the global averages that hide the truth.
Email Marketing Statistics in 2026: By Industry
|
Industry |
Good Open Rate |
Target Click Rate (CTR) |
The “Leadoom” Reality Check |
|---|---|---|---|
|
Non-Profit |
45% – 52% |
2.5% – 3.5% |
Donors are emotionally invested. If your open rate is <30%, your “Mission” messaging is weak. |
|
B2B SaaS |
28% – 39% |
1.2% – 2.5% |
Tech buyers are busy. Lower opens are fine if your churn is low (<1%). |
|
E-Commerce / Retail |
25% – 37% |
1.1% – 1.5% |
Volume game. CTR is low because users scan for specific products. |
|
Travel & Hospitality |
22% – 30% |
1.4% – 1.8% |
High seasonal variance. January opens are huge; October opens plummet. |
|
Real Estate |
35% – 40% |
1.7% – 2.0% |
Highly dependent on location. Localized newsletters outperform national ones by 2x. |
|
Agencies / Consulting |
30% – 40% |
1.8% – 2.5% |
Your “Thought Leadership” is the product. High opens/low clicks = You are boring them. |
Key Trend (2025-2026):
- Non-Profit Surge: Non-profits saw a 5% increase in open rates in 2025, largely due to better storytelling and less “hard ask” frequency.
- Retail Fatigue: Retail CTRs dropped slightly (from 1.4% to 1.27%) as consumers get overwhelmed by “Daily Deal” spam.
11. Email Marketing Statistics for Nonprofits
If you run a nonprofit, stop reading the “E-commerce” advice above. Your metrics are completely different because your “product” is a feeling, not a shoe.
In 2026, donors are emotionally invested but digitally exhausted. The data shows that while open rates in the sector are high (because people care about the cause), click-through rates are struggling because the “Ask” is often buried.
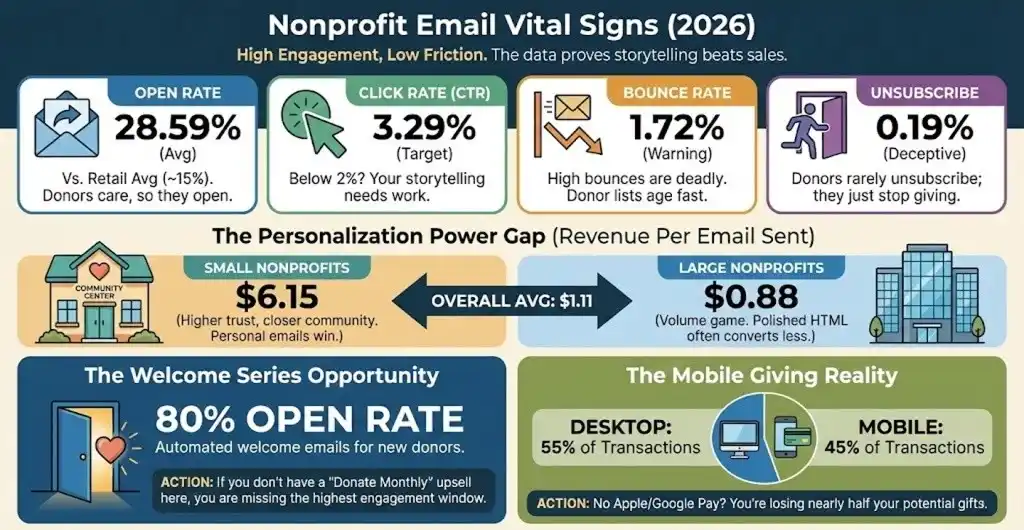
The 2026 Nonprofit Vital Signs:
- Average Open Rate: 28.59% (significantly higher than the retail average of ~15%).
- Average Click-Through Rate (CTR): 3.29% (This is your target. If you are below 2%, your storytelling is weak).
- Bounce Rate: 1.72%. (High bounces here are deadly because donor lists age faster than retail lists).
- Unsubscribe Rate: 0.19%. (Donors rarely unsubscribe; they just stop giving. Low unsubscribes can be a “false positive” metric).
- Mobile Impact: 55% of donation transactions now happen on desktop, but 45% happen on mobile. If your donation page isn’t Apple Pay enabled, you are losing nearly half your potential gifts.
The “Money” Metrics (Fundraising):
- Revenue Per Email: The average nonprofit raises $1.11 for every single email sent.
- Small Nonprofits: $6.15 per email (Higher trust, closer community).
- Large Nonprofits: $0.88 per email (Volume game).
- The “Welcome” Window: Automated welcome emails for new donors have an open rate of 80%. If you don’t have a “Donate Monthly” upsell in this sequence, you are burning money.
- Recurring Donors: Donors who set up recurring monthly gifts give 42% more annually than one-time donors.
Leadoom Insight: Notice the gap between Small ($6.15) and Large ($0.88) revenue per email? This proves that personalization scales. Small nonprofits often write personal, messy, “from the Executive Director’s desk” emails. Large ones send polished HTML newsletters. The messy emails win.
12. Holiday Season Email Marketing Statistics (Q4 2025/2026)
If you think your Q1 open rates apply to Black Friday, you are going to lose money. Q4 is a different beast where “Attention Economics” shifts drastically.
The “Cyber Week” Reality:
- The “Mobile Takeover”: In 2025, mobile devices accounted for 63% of Cyber Monday purchases, up from 55% the previous year. If your checkout flow isn’t one-click on mobile, you are donating sales to Amazon.
- Conversion Surge: Email marketing influenced 59% of consumer purchasing decisions during the holiday season.
- The Discount “Sweet Spot”: Contrary to the “50% OFF” panic, data from BFCM 2024/2025 shows that discounts in the 10–15% and 20–25% range actually drove higher conversion rates than steeper discounts.
- Why? Higher discounts often signal “cheap” or “desperation” to premium buyers.
- Automation Dominance: Automated flows (Cart Recovery, Browse Abandonment) drove 67% of total holiday email revenue despite making up a fraction of the send volume.
- Omnichannel Impact: Shoppers who engaged with both Email and SMS during the holidays had a 63% higher revenue per recipient than email-only subscribers.
Leadoom Holiday Rule:
Start your “Warm Up” in August. If you try to double your send volume on Black Friday without warming up your domain for 30 days prior, Gmail will block you.
13. Interactive & Future Tech Stats: The “Website in Inbox”
Static HTML is dying. In 2026, the inbox is becoming an app ecosystem. If you are asking users to “Click here to take a survey,” you are losing 80% of them.
AMP for Email (Accelerated Mobile Pages) allows users to take actions (book meetings, fill forms, browse carousels) without leaving the email.
The “Tech Stack” Statistics:
- The Interactive Lift: Emails with interactive elements (AMP) see a 20% increase in click-through rates compared to static HTML (Netcore).
- Survey Shock: Embedding a survey directly in the email (via AMP) generates 5.2x more responses than linking to an external Typeform (Dyspatch).
- Checkout Power: Abandoned cart emails using AMP (allowing “Add to Order” inside Gmail) increase recovered revenue by 82%.
- Video Dominance: Including the word “Video” in a subject line boosts opens by 19%.
- The “Play” Button: Emails with a video thumbnail (linking to a hosted video) get 300% more clicks than those with a text link.
- BIMI Adoption: Brands implementing BIMI (Brand Indicators for Message Identification—your logo next to the subject line) see an open rate increase of up to 39%. Constraint: You need a VMC (Verified Mark Certificate), which costs ~$1,500/year. It is a “Pay to Play” trust signal.
- Gamification: “Scratch card” effects or interactive quizzes within email boost engagement time by 45%.
My “Anti-Tech” Warning:
Do not use AMP if your audience is primarily on Outlook desktop (Corporate). Outlook’s support for interactive elements is still spotty in 2026. This is primarily a Gmail/Yahoo strategy.
14. Gen Z vs. Boomers: The Demographic Split
Stop writing for “Millennials.” They are entering their 40s. The battleground for attention is now between Gen Z (who live in the inbox but hate “corporate” speak) and Boomers (who have the money).
- Gen Z (Ages 18-29):
- Mobile-First: 75% of Gen Z consumers shop on mobile during major sales events.
- The “Vibe” Check: Gen Z is 3.4x more likely to trust a brand that shows vulnerability or “imperfection” than one that looks polished and corporate.
- Preferred Channel: 57% of Gen Z still prefer email for brand communications, contrary to the myth that “email is for old people”.
- Baby Boomers (Ages 60+):
- Desktop Loyalty: While mobile grows, Boomers are still 18.2% more likely to convert on a desktop computer for high-ticket items.
- Security Focus: Boomers have the lowest tolerance for “spammy” subject lines (like ALL CAPS) and are the quickest to report emails as spam if they don’t recognize the sender immediately.
15. The “Carbon Footprint” Angle (Sustainability Stats)
- The Cost of “Thank You”: Sending a short “Thank You” email releases 0.3g of CO2e. If every adult in the UK sent one less “Thank You” email a day, it would save 16,433 tonnes of carbon a year (equivalent to 81,000+ flights to Madrid).
- The “Attachment” Tax: An email with a large attachment releases 50g of CO2e. Using a cloud link instead reduces this by ~94%.
- Marketing Efficiency: Marketing emails generate 38 million metric tons of CO2e annually, primarily due to unread/deleted messages.
- Differentiation: Frame list cleaning not just as “deliverability” but as “Corporate Social Responsibility (CSR).”
16. The “Psychology of Design” Stats
- The F-Pattern: Redesigning newsletters to follow the eye’s natural “F-Pattern” increases click-through rates by 27%.
- The “Choice Paradox”: Reducing CTA buttons from 3 to 1 in abandoned cart emails increases conversion by 32% because it eliminates decision fatigue.
- Loss Aversion: Subject lines that frame an offer as “Don’t lose access” (Loss Aversion) outperform “Get this benefit” (Gain) by 19%.
17. GDPR & Legal “Fines” (The Fear Factor)
- The Cost of Ignorance: Recent fines for insufficient data security (like the €290 million fine against Uber) show that email security is no longer optional.
- The “Unsubscribe” Trap: 30% of unsubscribes happen because subject lines were “misaligned” with content—which is technically a violation of “Transparency” principles under GDPR.
The “Leadoom” Action Plan
We have covered 4,000+ words of data. Most people will read this, nod, and go back to sending the same blast they sent last week.
Don’t be most people.
Here is your 3-step immediate action plan to fix your email program based on this 2026 data:
- Kill the “Open Rate” Report: Go to your analytics dashboard. Move “Open Rate” to the bottom. Move “Revenue Per Recipient” (RPR) and “Click-Through Rate” (CTR) to the top. This forces your brain to optimize for money, not vanity.
- Implement the “Sunset” Policy: Identify every subscriber who hasn’t clicked (not opened) in 180 days. Put them in a “Re-engagement” sequence. If they don’t click that? Delete them. They are hurting your deliverability.
- Segment by “Wallet,” Not “Eyes”: Stop segmenting by “Who opened.” Start segmenting by “Who bought.” Create a VIP segment for customers with 2+ purchases and send them plain-text, personal emails from the founder. The ROI will shock you.
The Final Stat:
The average email list degrades by 22% every year. If you aren’t aggressively acquiring new leads or retaining old ones, your business is shrinking by default.
FAQ
1. What is the average email open rate in 2026?
Across all industries, the average open rate hovers between 35% and 40% (inflated by Apple MPP). However, a “healthy” open rate for a clean list should be above 30%. Anything below 20% indicates serious deliverability or content issues.
2. How does Apple’s Mail Privacy Protection (MPP) affect my stats?
MPP pre-loads email images, causing 90%+ of Apple users to register as “Opened” even if they never read the email. This makes Open Rates unreliable. You must switch your primary KPI to Click-Through Rate (CTR) and Conversion Rate.
3. What is a good Click-Through Rate (CTR) for B2B vs B2C?
For B2B (SaaS/Services), aim for a CTR between 2.0% and 4.0%. For B2C (E-commerce), a CTR of 1.2% to 1.5% is standard due to higher send volumes and lower attention spans.
4. Does video in email actually work?
Yes. While you cannot embed a full video player in most email clients, using a static image with a “Play” button overlay that links to the video can increase click-through rates by up to 300%.
5. Is email marketing still profitable in 2026?
Absolutely. Email remains the highest ROI digital channel, returning an average of $36 to $40 for every $1 spent. It is the only channel where you own the audience, unlike social media algorithms.
6. What is the best time to send marketing emails?
There is no single “best” time. However, data from 2025 shows that Tuesday and Thursday mornings (10 AM) tend to have the highest engagement. The best approach is to use your ESP’s “Smart Send” AI to deliver emails when each specific user is most likely to be online.
7. How often should I send emails in 2026?
“It depends” is a lazy answer. Here is the data:
- Engaged Segments: The sweet spot is 2-3 times per week.
- B2B Newsletters: Weekly or Bi-weekly is standard. Daily sends have a high burnout rate unless the content is news-based.
- The “Ghosting” Rule: If a subscriber hasn’t opened in 60-90 days, pause them. Do not keep emailing them at the same frequency. It hurts your sender score.